


round penetrating radar (GPR) is often used to image the shallow subsurface and investigate subsurface infrastructure. Frequently overlooked shallow structures are the tunnels and burrows that are excavated by burrowing animals. While potentially only centimetre-scale in diameter, a single, interconnected tunnel network may extend over several hundred meters and therefore, it contributes to the pore-space, influences subsurface hydrology and/or may destabilize embankments and other earthworks.
GPR is known to provide the highest image resolution of subsurface structures in a relatively short amount of survey time. Due to their potentially complex structure and small size, animal tunnels are an especially challenging target for all available geophysical methods. In contrast to other methods e.g., excavations of the tunnel network, a GPR survey leaves the animals and the subsurface completely undisturbed. Therefore, conducting GPR surveys allows imaging the extent and – when applied in a repeated manner – the temporal development of the tunnel network without exposing the animals and the subsurface to unnecessary disturbance.
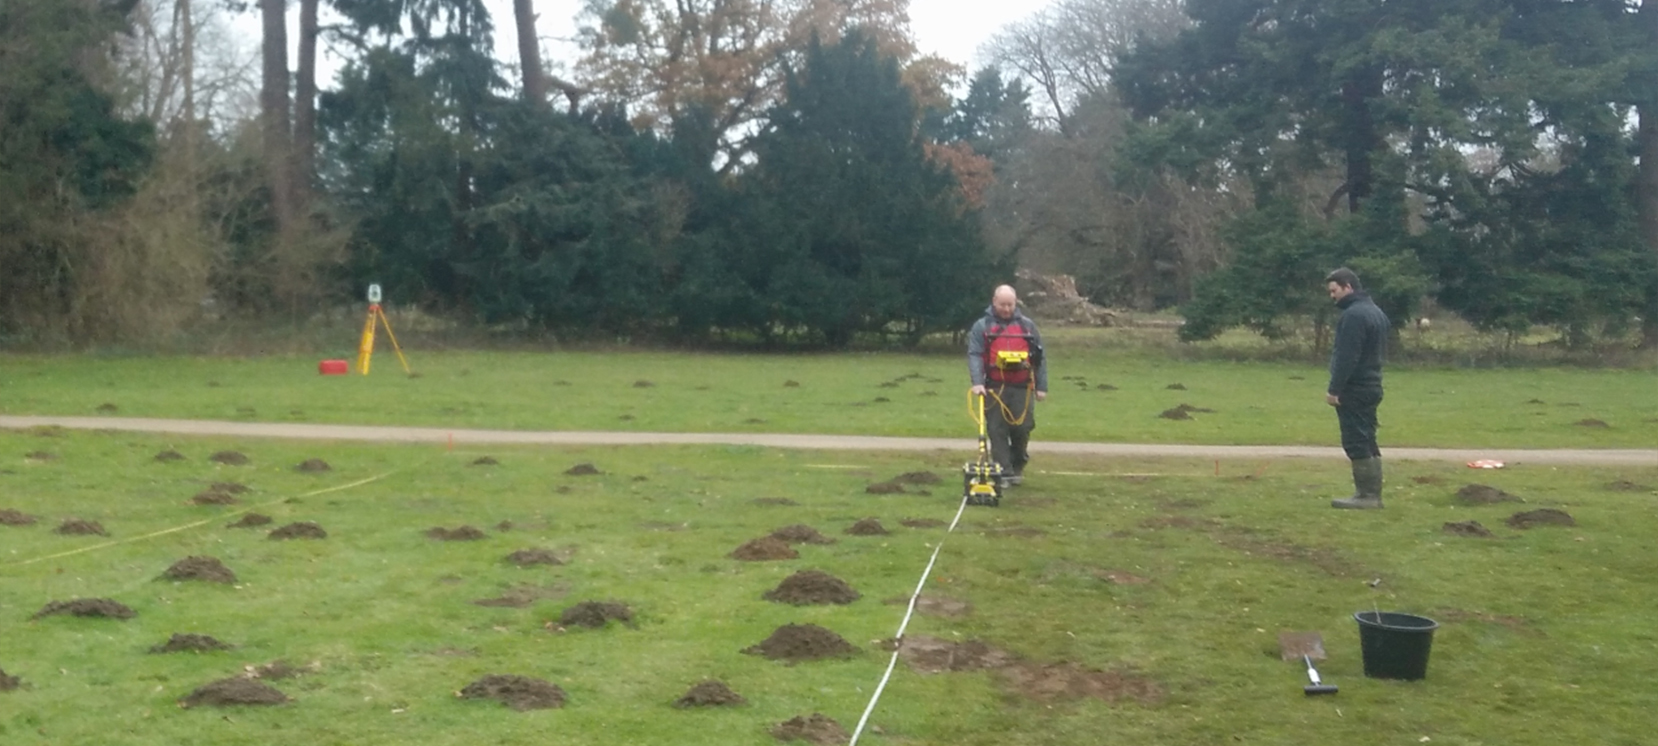
To demonstrate the suitability of GPR for imaging and monitoring such small-scale features, we conducted a GPR survey on a field with clearly visible mole activity in Tubney, Oxfordshire, UK (Figure 1). Mole tunnel systems are often extensive, and the tunnels are small in diameter (approx. 0.05 m), making mole tunnel systems ideal for testing the applicability of GPR for imaging and monitoring the geometry of such features. To test these GPR capabilities, we conducted two surveys, one year apart, using a pulseEKKO PRO® system using a set of transducers with a 1000 MHz centre frequency. In previous surveys, we found that a high precision positioning system is essential for such an application. Therefore, we used a self-tracking total station (Figure 1), which tracks the GPR antennas and transmits real-time coordinates to the GPR acquisition system. With this setup, both 3D GPR data sets were acquired with an inline trace spacing of approximately 1 cm and a line spacing of approximately 5 cm.
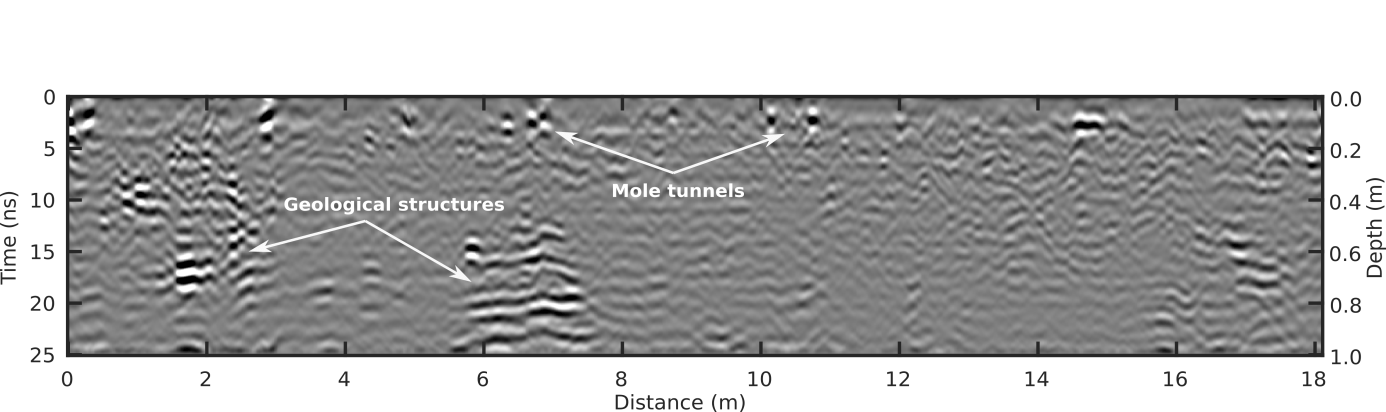
We applied advanced GPR processing to the recorded data; this included background removal, bandpass filtering, amplitude correction, data gridding to a regular surveying grid with 2 cm node spacing, and a Kirchhoff based migration scheme. The result of this processing scheme is a densely spaced 3D GPR volume, showing subsurface structures down to a depth of approximately 1 metre. When interpreting the migrated GPR profiles (e.g., Figure 2), we found a rather uniform sedimentary background with few visible geological structures. However, in the uppermost 5 ns of the profile (which is ~0.2 m), we observed small-scale features with high amplitudes that interrupt the otherwise continuous GPR image.
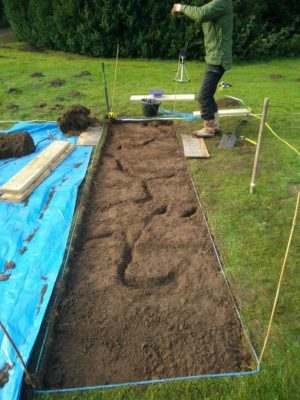
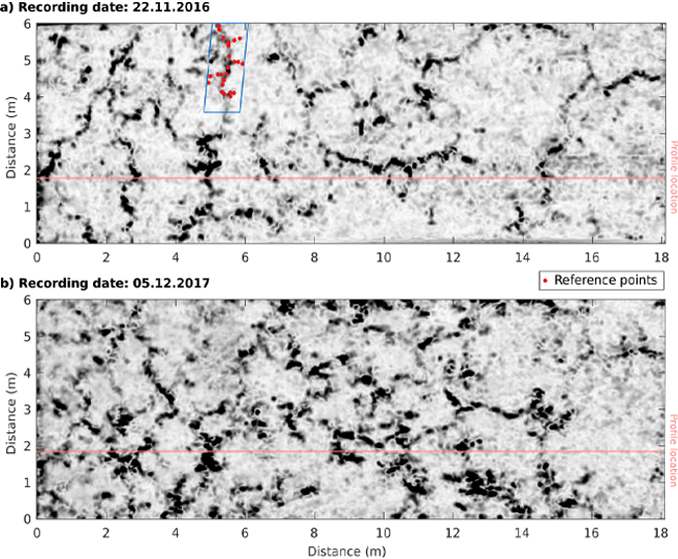
To calibrate our observations, we excavated a soil pit (Figure 3). This excavation revealed a mole tunnel network at a depth between ~0.05 m and ~0.25 m, which we mapped by measuring selected tunnel positions and junctions (plotted as red dots in Figure 4). We continued excavating up to ~0.70 m depth and, as also indicated in the GPR results, found no deeper tunnels. When looking at a time slice (Figure 4), a horizontal map through the GPR volume, we identify a complex network of high amplitude anomalies, which correspond well to the ground truth information from our excavation.
With this case study, we demonstrated the applicability of GPR for imaging small and complex animal tunnels within the shallow subsurface. We believe our imaging and monitoring approach including the highly precise acquisition and repeatable GPR data collection will make it possible to examine and monitor animal activities that are difficult to study using other methods.
More information, including the monitoring results and data acquisition and processing strategies, is available in the published article. Contact Sensors & Software for the reference.
Story courtesy of Niklas Allroggen, Jens Tronicke (Universität Potsdam), Adam Booth (University of Leeds), Sandra E. Baker, Stephen Ellwood (University of Oxford)


